Statistical Process Control System
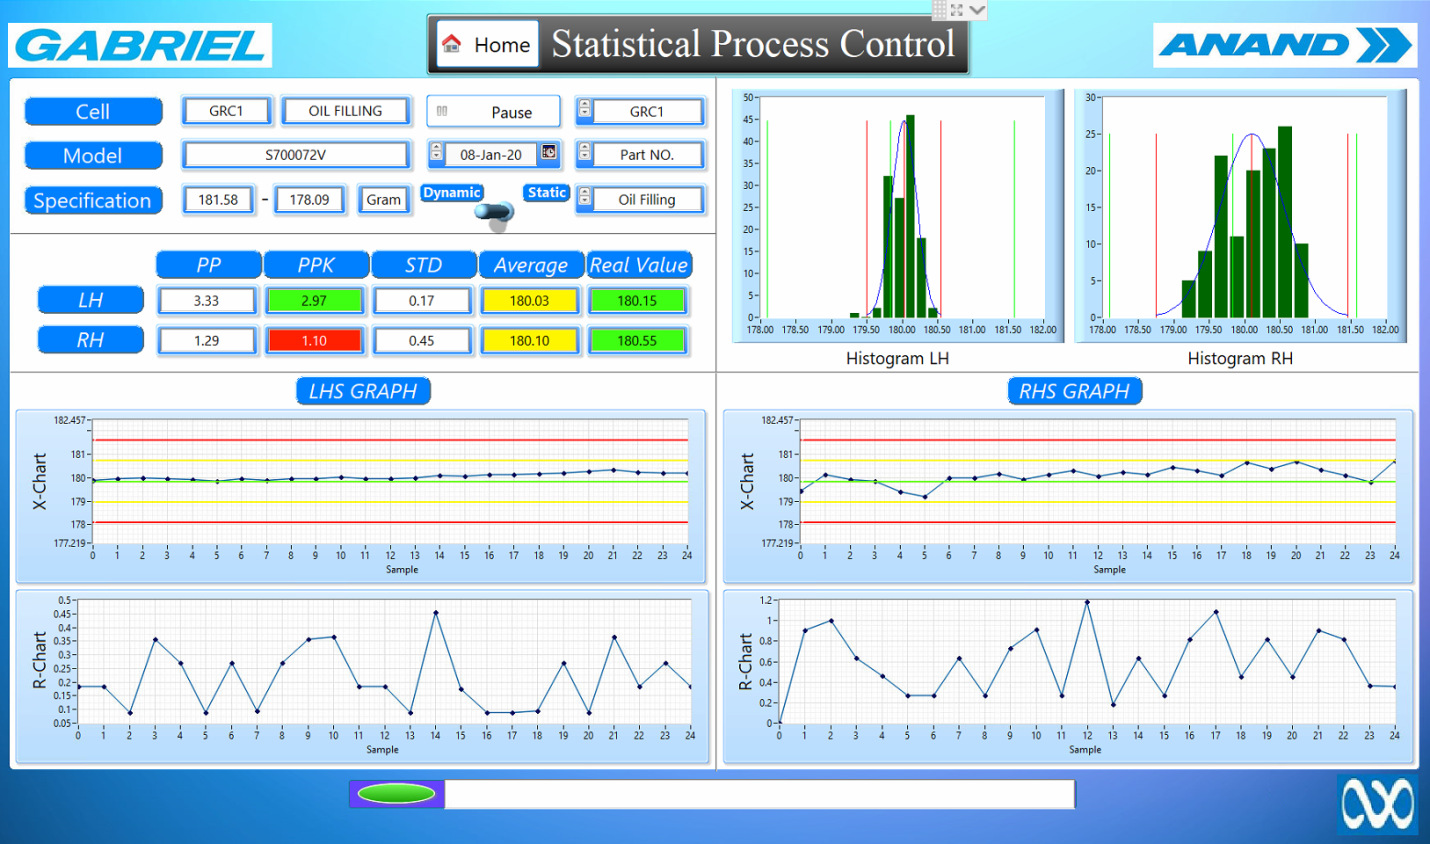
- The home screen is a rotating display which reads Oil filling and Torquing data from machine and plots the graphs according to the specifications.
- We can make the screen static by moving the button from dynamic to static and then selecting the date, line and application for which data is to be analyzed.
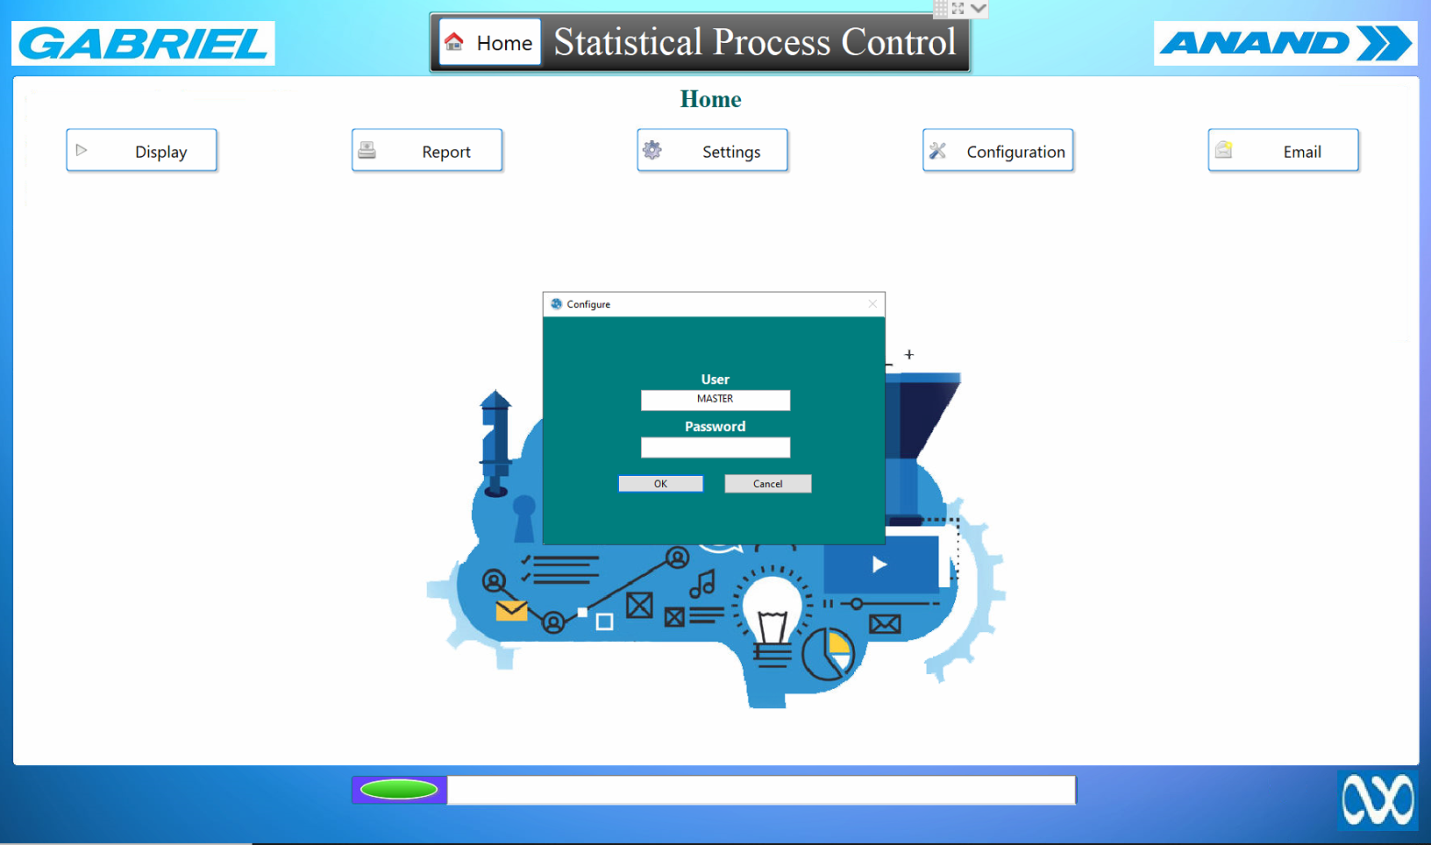
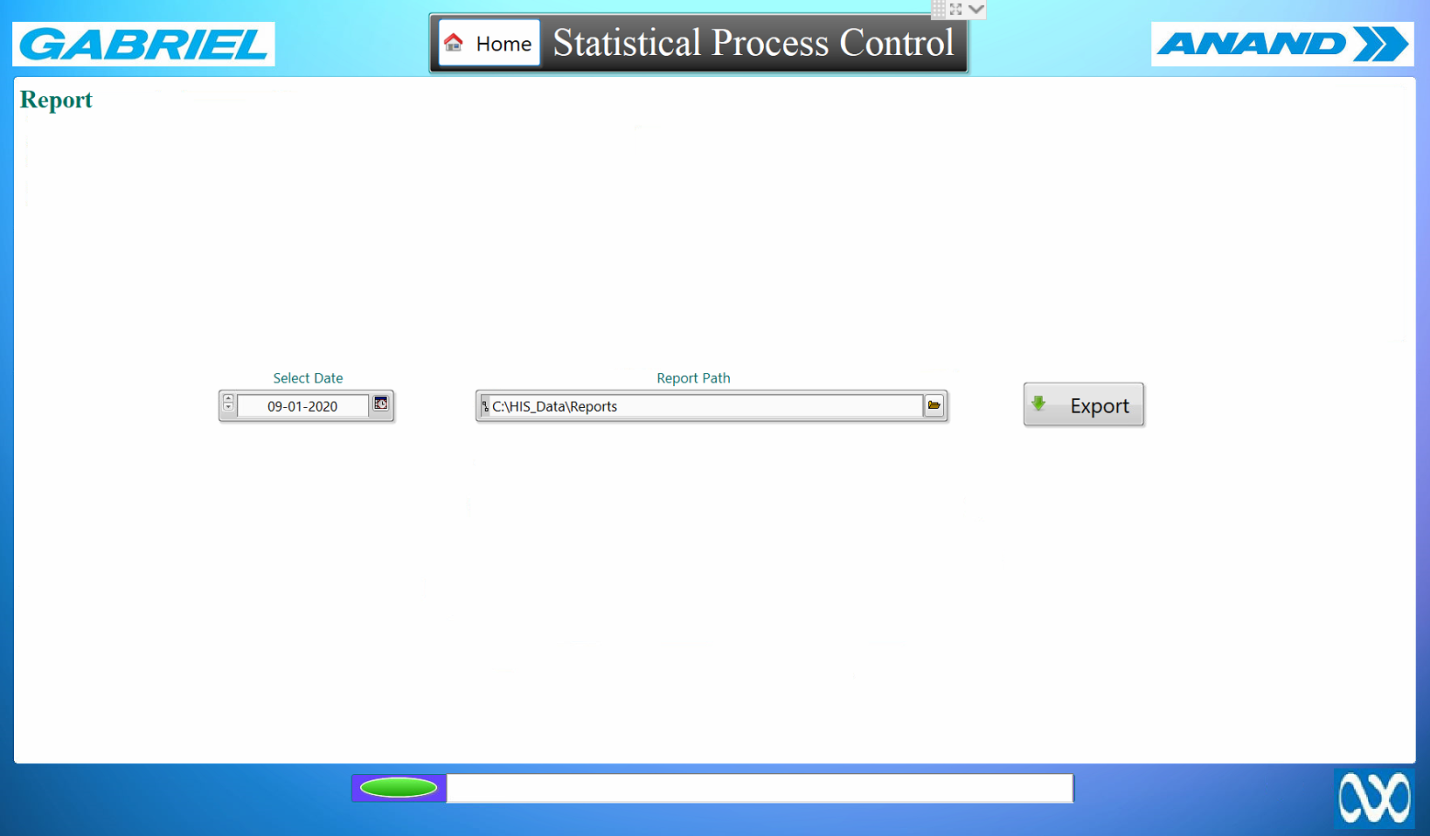
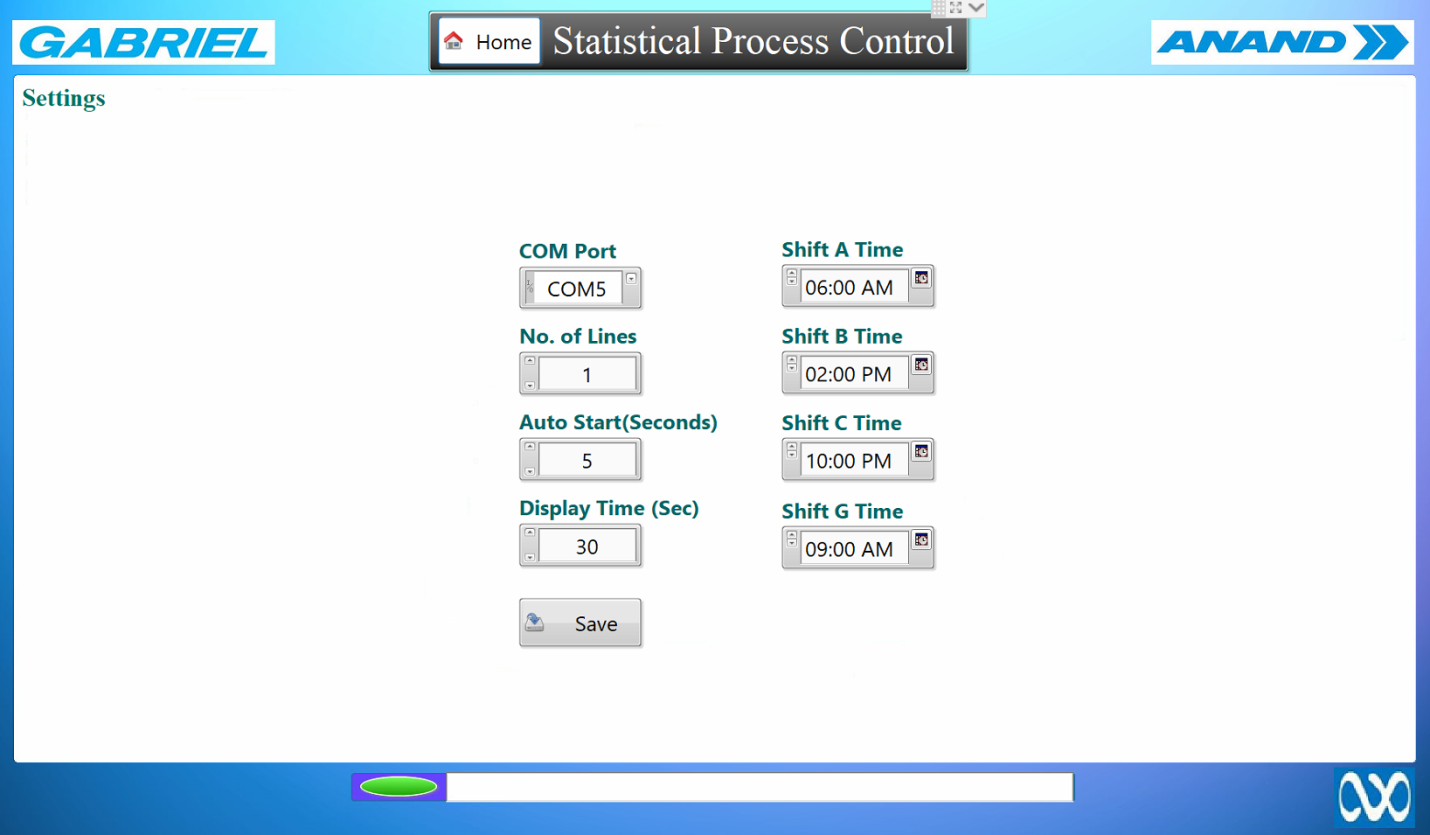
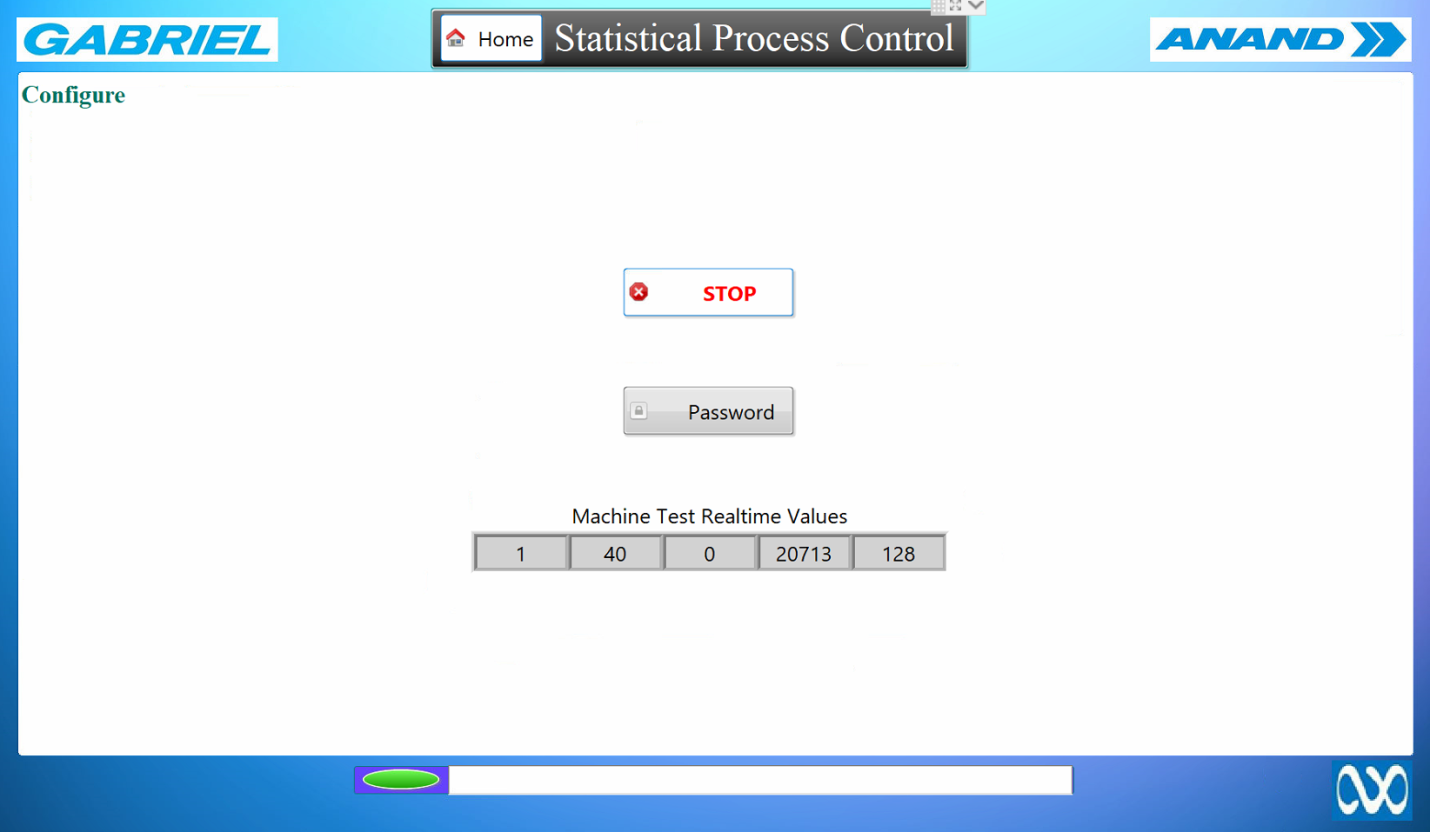
- Display screen is open for all but all the other screens are password protected which can be changed configuration screen.


Rational Subgroups
A rational subgroup is a group of measurements produced under the same set of conditions. Subgroups are meant to represent a snapshot of your process. Therefore, the measurements that make up a subgroup should be taken from a similar point in time. For example, if you sample 5 items every hour, your subgroup size would be 5. Here in X-chart and R-chart subgroup size is 5 and 25 latest points are plotted on the graph.Process Capability (Pp) How do you know if your process is capable?
Process Capability Pp measures the process spread vs the specification spread. In other words, how distributed the outcome of your process is vs what the requirements are. Calculating Process Capability (Pp) Pp = (USL – LSL) / 6* s : where s the standard deviation, or the ‘fatness’ or dispersion of the bell curve.What is a ‘Good’ Process Capability (Pp) Number?
According to Six Sigma, we want a Pp of above 1.5 because that would reflect a process with less than 3.4 DPMO – the definition of 6 Sigma quality. Process Capability Index (Ppk) Ppk is another performance index that measures how close the current process mean’s proximity is to the specification limits. In other words, does this process deliver acceptable results? Calculating Ppk There are 2 ways to calculate Ppk, depending on how your process is aligning.Process Mean close to USL
If your Process Mean (central tendency) is closer to the USL, use: Ppk = [ USL – x(bar) ] / 3 s, where x(bar) is the Process Mean. Process Mean close to LSL If your Process Mean (central tendency) is closer to the LSL, use: Ppk = [x(bar) – LSL ] / 3 s, where x(bar) is the Process Mean. Interpreting Ppk Scores A Ppk of 1 means that there is “half of a bell curve” between the center of the process and the nearest specification limit. That means your process is completely centered.
What are X-Bar R-Control Charts?
X Bar R charts are the widely used control chart for variable data to examine the process stability in many industries (like Hospital patients’ blood pressure over time, customer call handle time, length of the part in production process etc.,). X bar R chart is used to monitor the process performance of a continuous data and the data to be collected in subgroups at a set time periods. It is actually a two plots to monitor the process mean and the process variation over the time and is an example of statistical process control. These combination charts helps to understand the stability of processes and also detects the presence of special cause variation. X-bar chart: The mean or average change in process over time from subgroup values. The control limits on the X-Bar brings the sample’s mean and center into consideration. R-chart: The range of the process over the time from subgroups values. This monitors the spread of the process over the time.

